
Indicators of Food Security
Food security is defined as when everyone has at all times access to and control over sufficient quantities of good quality food for an active healthy life while food insecurity refers to a lack of access to enough good, healthy, and culturally appropriate food. Household food security is the application of this concept to the family level, with the focus of concern being individuals within households. Food security is a generally difficult concept to measure accurately, especially in emergencies where food security status may be shifting rapidly, the requirements for data and analysis are high, and the time in which they are needed is short.
The traditional standard measure for household food security was an assessment of dietary energy intake using a 24-hour consumption recall. However, the collection, processing, and analysis of data in 24-hour recalls are extremely time-consuming. Moreover, the 24-hour recall methodology works best where the shift in daily consumption over the medium term is relatively little. For these reasons, we rarely apply 24-hour recalls if ever in emergencies.
Most measures of food security follow one or more of the “four pillars” of food security;
- Availability – This is determined by food prices, food balance sheets, production estimates, and household or market level food stocks.
- Access – This is the pillar that mostly triggers a humanitarian emergency.
- Utilization – This is determined by malnutrition, disease outbreaks, morbidity, and mortality.
- Stability – Income and sources, expenditures and expenditure ratios, and especially assets.
The most common key indicators used to analyze food insecurity are;
- Food consumption score.
- Coping strategy index.
- Expenditures
- Nutrition
Access Indicators
The major determinants of food access include:
- Sufficiency – The access to adequate amounts of food to ascertain that people have enough food to meet their energy requirements.
- Diversity – The access to different types of food necessary to meet the basic nutrient requirements.
- A psychological dimension that relates to restricted choice, deprivation, or anxiety about food.
- The social or cultural acceptance of consumption patterns.
1. Food Consumption Score (FCS)
This proxy indicator for current household food access is based on;
- Dietary diversity: This is the number of individual foods consumed over a reference period.
- Food frequency: This is the number of days (in the past week) of consumption of a specific food item.
- Nutritional importance: Food groups are weighted according to their nutritional importance.
When measuring the Food Consumption Score, the higher it is, the higher the dietary diversity and the frequency of those foods consumed. A high food consumption score also increases the probability of a household achieving nutrient adequacy. The FCS classifies households into three food consumption groups; Poor, Borderline, and Acceptable.
2. Coping Strategy Index (CSI)
Coping strategies refer to people’s responses to famine. In times of food stress, people opt to preserve productive assets in order to protect livelihoods, rather than meet immediate food needs. The types of coping strategies used by people in particular activities indicate their priorities and the severity of food insecurity. Some of the coping strategies that people adopted in the early stages of famine or drought include;
- Household members migrating in search of work and wild foods.
- Selling non-productive assets.
- Reducing food intake or changing the diet
To cope, people may also switch to cheaper food that may be less desirable and perhaps even less nutritious, or they may opt to reduce the portion or number of meals they consume. They may also choose to go hungry so as to preserve their productive assets and future livelihoods.
The measure of CSI provides an insight into how households are able to manage and cope during times of limited food access. The Coping Strategy Index is based on the frequency and severity of different coping strategies. The higher the CSI score, the more possible it is that the household is facing food insecurity. The CSI asks the question;
- What do you do when you have no access to enough food and don’t have enough money to buy food?
The probable answers are a series of behaviors regarding how households cope with a decline in food for consumption. They are formulated into a numeric score showing the frequency and severity of these coping behaviors.
Types of CSI
The two types of CSI are;
- Country-specific CSI – This type of CSI is based on a series of context-specific strategies and context-specific severity scores. It asks the question;
- During the past 30 days, did anyone in your household have to engage in certain behaviours due to lack of food or a lack of money to buy food?
- “Reduced” CSI – This type of CSI relies on the same shortlist of five coping strategies and the same severity weights. It allows comparison among areas and countries. It asks the question;
- In the past 7 days, were there times when you did not have enough food or money to buy food, and did you have to engage in certain behaviours?
The behaviors included fall into the following categories;
- Steps to change the dietary intake – Such as substituting cheaper and less desirable foods.
- Steps to increase the amount of food available at the household level even by unsustainable means – Such as borrowing, begging, buying on credit, and gathering wild foods.
- Steps to reduce the number of people to cater for – Such as short-term migration and sending children to other people’s households.
- Steps to cut on food rations or manage the decline – Include cutting the portion sizes of meals and prioritizing feeding some household members over others.
The CSI gives a semi-quantitative score indicating whether the status of household food security is declining or improving.
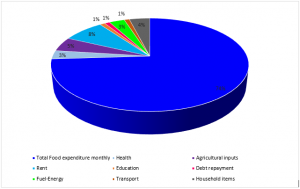
3. Expenditure
Household expenditure information is used as a proxy of purchasing power. Understanding household expenditures gives an insight into how households allocate scarce resources and give priority to competing needs.
Share of expenditure on food
Households that often spend a large proportion of their income or resources on food are deemed vulnerable to food deprivation. This is because regardless of their status of current food consumption, if they were to face a reduction in income, they would also likely experience a reduction in food consumption or the quality of food they eat.
Household expenditure
To measure the share of expenditure on food;
- 75+: very high (very vulnerable to food insecurity).
- 65–75: high.
- 50–65: medium.
- <50: low.
4. Nutrition indicators
The nutrition indicator used to measure food security is malnutrition. Malnutrition manifests as;
- Acute malnutrition (wasting)
- Chronic malnutrition (stunting)
- Underweight
To assess nutritional status, we look at;
Acute Malnutrition (Wasting (and edema))
This type of malnutrition is a result of deficiencies in any or all the necessary nutrients (micronutrients and macronutrients). Wasting or thinness occurs due to sudden and rapid loss of weight or failure to gain weight. It is measured by weight for height.
Chronic Malnutrition (Stunting)
This type of malnutrition occurs as a result of long-term nutrient deficiencies and/or repeated infections with inadequate catch-up growth. Stunting or shortness occurs due to insufficient nutrition over a long period of time and/or frequent infections & insufficient catch-up growth. It is measured by height for age.
Underweight Wasting + stunting
The three most useful nutrition indicators
As a general guide, the following thresholds are used to define risks to lives at the individual level:
- Wasting: Weight-for-height < -2z for children.
- MUAC: < 12.5 cm for children and <22.5 cm for women.
- BMI: < 16.0 (combined with an infectious disease such as HIV/AIDS or tuberculosis).
For more information, feel free to check out our Food Security & Nutrition in Emergencies course. Enroll today to get a 10% discount! Also, subscribe to our newsletter so you don’t miss out on our next blog on how you can judge the severity of food insecurity.
![]()